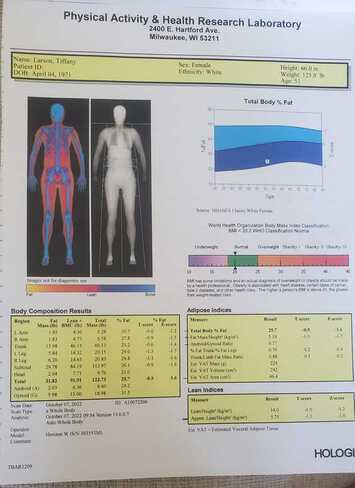
Skeletal muscle is protective and helps reduce metabolic conditions like high blood pressure, high blood sugar, excess body fat around the waist and abnormal cholesterol or triglyceride levels. Your body better regulates glucose when you have more lean muscle tissue thus protecting against diabetes and cardiovascular disease. Your resting metabolic rate will increase depending upon your percentage of lean muscle. The more muscle you have, the more your resting metabolic rate will increase and the more calories your body can consume while maintaining a healthy body composition. Lean muscle mass is essentially the biggest burner of calories. Conversly, if you go on a fad diet and lose weight quickly, undoubtedly you lose lean muscle tissue first, your resting metabolic rate decreases and your body composition becomes under-muscled and over-fat. You will not burn calories nearly as efficiently.
Simply put: DEVELOP AND PROTECT YOUR LEAN MUSCLE MASS
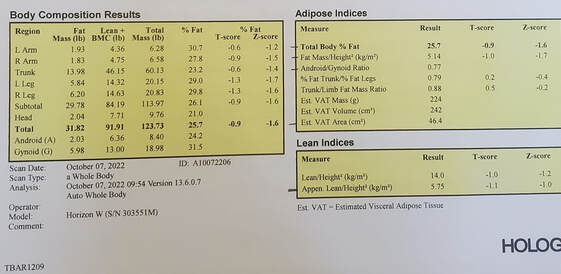
Based upon my results, while my body fat percentage is in a healthy range, I could afford to work on the "Lean Indicies," particularly the Appen. Lean/Height. This ratio looks at the appendicular skeleton, meaning muscle within your limbs (arms and legs) as compared to your height. There are research studies that correlate a disparity between your trunk skeletal muscle and limbs with frailty and fall risk later in life.
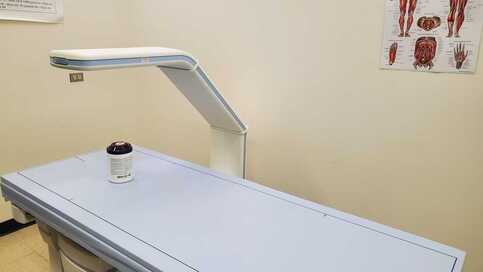
Whether athlete or average person, one will gain insight regarding their body composition. This is a sampling of the indices measured by the body scan. These definitions are copied from health.ucdavis.edu/sports-medicine/resources/dxa-info
Total Body Fat Percentage (%BF): The percent of the body that is composed of fat. This will change based on the amount of fat there is as well as the amount of lean mass there is. (You can see on the chart that mine was 25.7%)
Fat Mass Index (FMI): The total amount of fat you have (in kilograms) relative to your height (in meters2). It is a measure of how much total fat you have, relative to your size and independent of lean mass. (Mine was 5.1)
Visceral Adipose Tissue (VAT): VAT is a hormonally active component of total body fat. The measurement reflects the amount of internal abdominal fat around the organs. This is different than subcutaneous fat, which lies beneath the skin. Increased VAT has a high correlation to cardiovascular and metabolic disease risk. Current research shows and elevated risk at around 100-160 cm2 (Fortunately mine was 46.4cm2; a healthy range)
Android to Gynoid Ratio: The “apple” to “pear” shape ratio. It describes where the fat is stored. Android (apple shape) refers to having most of the fat around the stomach and mid-section. Gynoid (pear shape) refers to having the fat stored around the hips. A bigger number means more android and a smaller number means more gynoid. From a health risk standpoint, ideal values are believed to be less than 0.8 for women and 1.0 for men. Interestingly, after menopause many women begin to demonstrate more fat in the midsection (android) and smaller thighs. This has to do with the changes in hormones. (Currently my ratio is .7)
Appendicular Lean Mass to Height Ratio (ALM/Height2): The amount of lean mass in the arms and legs relative to height. A low ALM/Ht2 is a risk factor for sarcopenia (low muscle mass), primarily in lean individuals. Cut points in research are generally around 5.5 for women and 7.0 for men. (This was my biggest take-away. I need more skeletal muscle in my arms and legs to reduce my risk of fraility and sarcopenia in the future. My score was 5.75)
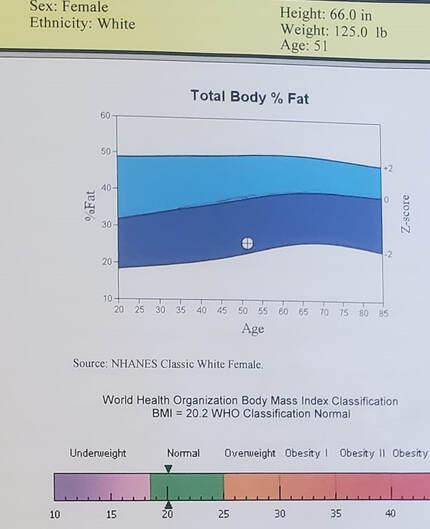
The percent body fat is graphed at the upper right-hand part of the report. There are three lines and two colors of blue. Between the 2 colors of blue is the middle line which is basically the average body fat expected for a given age and sex, but not necessarily ideal. Therefore, if you are below the middle line then your body fat is less than average, whereas if it is above the line, it is higher than average. Any value within the two blue regions would be where 95% of people would be found.
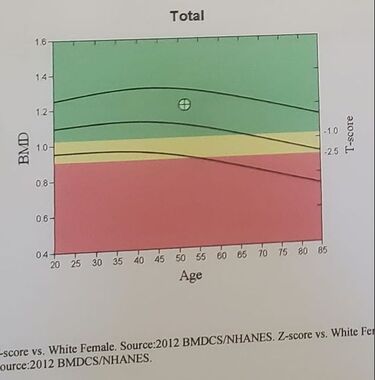
Bone Density: Shows how dense the bones are and can be used to assess the risk of osteopenia and osteoporosis. The z-score compares your bone density to what is normal for people similar in age and body size. The t-score compares your bone density to that of a 30-year-old. Anything higher than -1.0 is representative of normal bone density. Between -1.0 and -2.5 is a risk for osteopenia. Anything under -2.5 is a risk for osteoporosis. (Fortunately, my bone density T-score was 1.3 and Z score 1.1; well within normal limits for my age.)
The body composition results, adipose and lean indices are primarily provided as T-scores and Z-scores. It has taken some research on my part to better understand the importance of these ratios and some of the correlations between good health, longevity, and resilience versus fragility/frailty. Whether obese or "skinny-fat" the results from this type of scan may provide motivation for your health goals. I would benefit from additional guidance in interpretation and certainly recommend you have this test conducted by an expert in exercise physiology which was made available to me at UW-Milwaukee through Dr. Scott Strath.Thanks for reading!uwm.edu/pahrlab/services-facilities/
 RSS Feed